

Disclaimer: This is an experimental activity I’m doing with AI for my own purposes, nothing in this post should be used by anyone for anything other than entertainment and informational purposes particularly around potential capabilities of AI. DO NOT USE THESE PROBABILITIES FOR ANY INVESTMENT PURPOSES.
I’ve written about how I do my own bond analysis here 1, here 2 and here 3. The 3rd here has the manual process I had been using to do my own bond analysis. It was so cumbersome that I opted to simply buy bond ETFs but the yields on some bonds are now approaching 8% tax-equivalent yield and I wanted to get back in the game.
AI To The Rescue
I decided to try to use AI to streamline my work and I’m blown away about how much faster AI did a ton of work for me. Not only did it do what I wanted, it added extra data and even whipped out a web page for me to summarize the data!
Let me show you the steps.
Step 1. I received a few emails from Fidelity about some new bond offerings. I hacked together the image below to simplify since these are very large tables with many different rates and bond maturities.
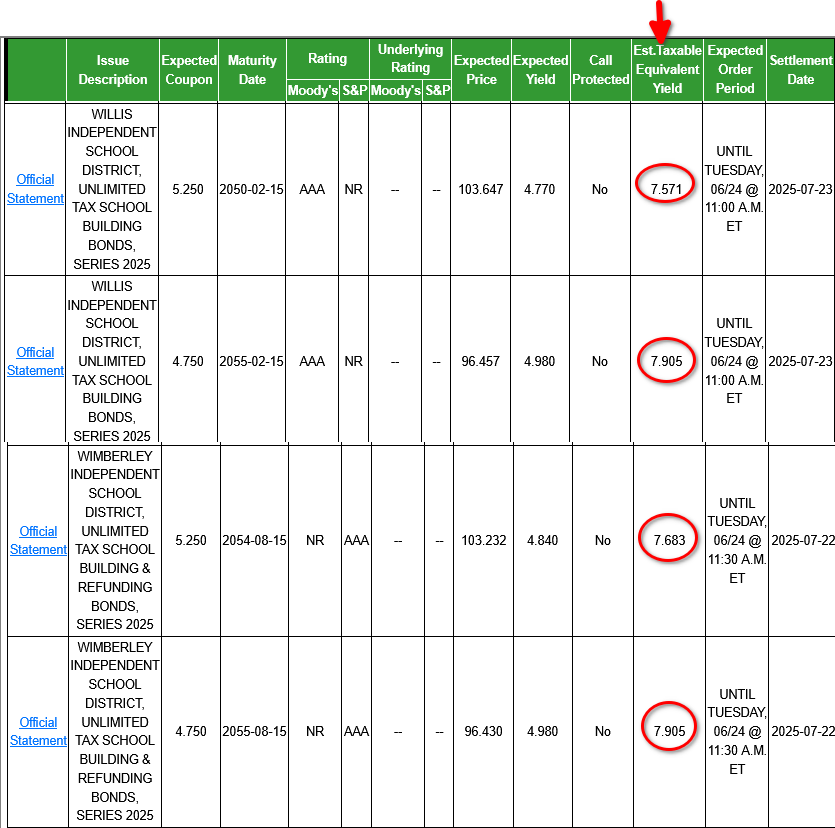
There are two bond offerings in the image above from Wimberley ISD and Willis ISD. Both districts are in Texas counties. The tax equivalent yields are 7.905% with paid yield at 4.98 for the 2055 maturity.
Step 2. Look up these two school districts in Census Reporter to get demographic data.
Step 3. Snapshot the data and upload to AI.
Step 4. Ask AI to analyze the two data sets, bond offerings and assign a probability of default to both offerings.
AI produced a more detailed report but that would be too cluttered for this blog so I am posting an AI summary below that it generated for me too! The report uses demographic factors and assigns a weighting to each then calculates the probability of default based on the demographic information.
Bond Probability of Default Analysis
Overview
This document provides a comparative analysis of the probability of default (PD) for two school district bond issuances based on demographic and economic indicators.
Key Factors Considered
| Factor | Willis ISD | Wimberley ISD |
|---|---|---|
| Population | 49,444 | 16,304 |
| Median Household Income | $82,775 | $87,307 |
| Per Capita Income | $41,723 | $50,366 |
| Poverty Rate | 9.5% | 13.1% |
| High School Graduation Rate | 87.7% | 93.2% |
| Bachelor’s Degree or Higher | 28.4% | 49.2% |
| Median Home Value | $263,100 | $481,200 |
| Owner-Occupied Housing | 80% | 80% |
| Population Aged 60+ | 29% | 39% |
Scoring & Adjustment
| Risk Factor | Willis ISD | Wimberley ISD |
|---|---|---|
| Income & Wealth | 3 | 5 |
| Education | 3 | 5 |
| Tax Base Stability | 3 | 5 |
| Population Size/Growth | 5 | 2 |
| Economic Vulnerability | 4 | 3 |
| Weighted Score | 3.45 | 4.35 |
PD Mapping Table
| Score | Implied Credit Risk Rating | Estimated PD (10-year horizon) |
|---|---|---|
| 4.5 – 5.0 | Aaa | 0.01% – 0.02% |
| 4.0 – 4.49 | Aa | 0.02% – 0.05% |
| 3.5 – 3.99 | A | 0.05% – 0.10% |
| 3.0 – 3.49 | Baa | 0.10% – 0.25% |
| < 3.0 | Below Investment Grade | > 0.25% |
Final PD Estimates
| District | Score | Implied Rating | Estimated 10-Year PD |
|---|---|---|---|
| Wimberley ISD | 4.35 | Aa | 0.03% |
| Willis ISD | 3.45 | Baa | 0.10% |
These PD estimates are approximations based on demographic and economic profiles and do not reflect actual bond ratings or issuer financial statements.
Based on demographic data, AI thinks Wimberley ISD has a lower chance of defaulting and thus has a higher implied rating over Willis.
What normally took me a couple of hours to analyze now took a few minutes and I am just blown away!
I will try to automate this whole process further with AI agents and attempt to build my own personal municipal bond analyzer in the future now that I have plenty of free time. I also have a few ideas on applying this to other topics but that’s a post for another day.
Share The Wealth
It’s only a matter of time before AI eats everyone’s lunch so what are you feasting on to join the party? Let me know in the comments below.