

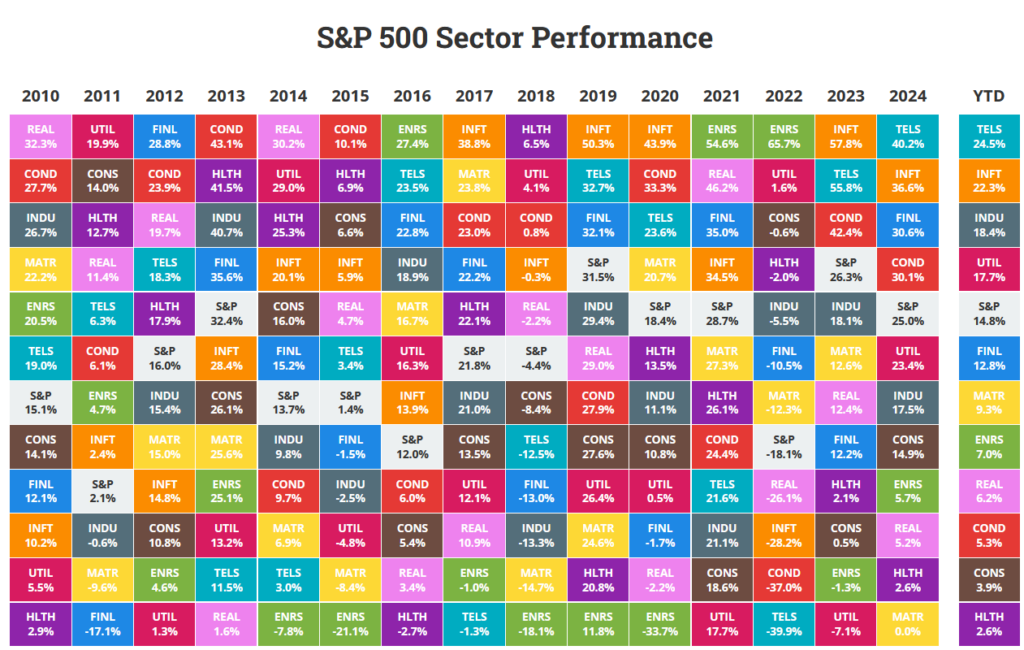
I continue to play with AI and I’m loving the speed of the research capabilities. This tool reduces hours of work down to minutes and my latest play with it was to create a 3 ETF portfolio for a recession period but with the caveat to build it for a quick recovery. The assumptions I am putting into the model are a two year recession from 2026 to 2027 and use the image below as a starting point.
AI
Below is a 10-year strategic portfolio allocation using the three chosen sectors — Technology, Energy, Industrials — with an explicit assumption of a recession in 2026–2027.
The portfolio is structured to:
- Defend during the recession
- Position for recovery in 2028–2030
- Capture long-term growth through 2035
📌 Recommended 10-Year Portfolio Allocation
(Assuming a Recession in 2026–2027)
🟦 1. Technology (40%)
Rationale:
- Long-term secular growth and top historical performance
- Historically the strongest sector coming out of recessions
- Might decline more during the recession (2026–2027), but gains it back faster
Allocation Breakdown:
- 30% Core Tech (broad exposure)
- 10% High-growth subsectors (AI, semiconductors, cloud)
Suggested ETFs:
- VGT – Vanguard Information Technology ETF (broad U.S. tech)
- XLK – Technology Select Sector SPDR
- QQQ – Nasdaq-100 ETF (more growth-heavy)
- SMH / SOXX – Semiconductor ETFs (AI + chip leadership)
🟩 2. Industrials (35%)
Rationale:
One of the most stable sectors during downturns
Major beneficiary of:
- U.S. infrastructure spending
- Manufacturing reshoring (U.S. + Europe)
- Robotics & automation
- Smooths out volatility from Technology & Energy
- Historically rebounds early during recovery cycles
Suggested ETFs:
- XLI – Industrials Select Sector SPDR
- VIS – Vanguard Industrials ETF
- ITA – Aerospace & Defense ETF (excellent recession hedge)
🟧 3. Energy (25%)
Rationale:
- Historically outperforms during inflationary or geopolitical shocks
- Provides high dividend income to soften recession effects
- Renewable transition + underinvestment in oil supply = tight markets
- Not ideal during recession, but strong in the late-cycle and recovery phases
Suggested ETFs:
- XLE – Energy Select Sector SPDR (oil & gas majors)
- VDE – Vanguard Energy ETF
- ICLN / TAN – Renewables ETFs (satellite positions)
- AMLP – MLP income ETF (very defensive, high yield)
📉 How the Portfolio Handles the 2026–2027 Recession
Technology (40%) – Will Decline the Most, but Recover the Fastest
Expect Tech to fall harder in the recession (as it usually does).
But historically:
- After 2001 dot-com crash → massive multi-year rebound
- After 2008 crisis → Tech became the #1 performing sector of the 2010s
- After 2020 COVID drop → Tech surged ahead again
→ Tech will drive most of the gains in 2028–2035.
Industrials (35%) – Provides Mid-Cycle Stability
- Performs relatively well in recessions
- Strong early-cycle rebound in rebuild/expansion years
- Reduces portfolio volatility
→ This is your “reliability engine” through recession years.
Energy (25%) – Hedge + Late-Cycle Strength
May dip during demand contraction, but supported by:
- Ongoing structural underinvestment
- Geopolitical supply risks
- Long-term fossil + renewable capex cycle
→ Sectors like energy historically outperform late in recessions and early in inflationary recoveries.
🔧 Optional Tactical Tilt (If You Want to Be More Defensive in 2026–2027)
January 2026 Recession Start (Assumption):
Sector Recession Tilt Reason
Technology Reduce from 40% → 30% Lower volatility exposure
Industrials Hold at 35% Stability + early recovery
Energy Increase from 25% → 35% High dividends + inflation hedge
Then reverse back in late 2027 or early 2028:
- Tech 40–45%
- Industrials 35%
- Energy 20–25%
This mirrors historical best performance patterns across recession cycles.
📌 Final Portfolio Summary (Strategic 10-Year Plan)
Strategic Long-Term Allocation
- 40% Technology
- 35% Industrials
- 25% Energy
During 2026–2027 Recession (Optional Tactical Tilt)
- 30% Technology
- 35% Industrials
- 35% Energy
ETF Lineup Summary
Technology: VGT, XLK, QQQ, SMH
Industrials: XLI, VIS, ITA
Energy: XLE, VDE, AMLP, ICLN
Recession Test
Below is a full recession stress test of the recommended portfolio allocation, assuming a 2026–2027 recession followed by a recovery through 2035. This analysis uses historical sector behavior from past recessions (2001, 2008, 2020) as a model for expected drawdowns and recovery patterns.
🧪 Recession Stress Test (2026–2027)
Testing the Strategic Allocation:
40% Technology / 35% Industrials / 25% Energy
1️⃣ Sector-by-Sector Recession Shock Assumptions (Historical-Based)
🟦 Technology (INFT)
Historically the most volatile sector during recessions.
- 2001 recession: –57% (tech bubble)
- 2008 recession: –41%
- 2020 recession: –17% (very brief)
Stress Test Assumption:
▶ –30% decline in 2026
▶ –10% decline in 2027
▶ +25% rebound in 2028, +15% in 2029
🟩 Industrials (INDU)
Historically moderate declines but strong early-cycle recovery.
- 2001: –14%
- 2008: –39%
- 2020: –15%
Stress Test Assumption:
▶ –12% decline in 2026
▶ –5% in 2027
▶ +18% rebound in 2028, +12% in 2029
🟧 Energy (ENRS)
Highly tied to inflation, supply shocks, and late-cycle recoveries.
- 2001: –12%
- 2008: –35%
- 2022: +65% (inflation shock, not recession)
Energy can fall early in a demand recession, then spike on recovery + inflation.
Stress Test Assumption:
▶ –15% in 2026
▶ Flat (0%) in 2027
▶ +22% rebound in 2028, +15% in 2029
2️⃣ Portfolio-Level Stress Test Results
We now apply the weighted allocation:
➤ 2026 Decline
- Tech: –30% × 40% = –12.0% impact
- Industrials: –12% × 35% = –4.2% impact
- Energy: –15% × 25% = –3.75% impact
📉 Total Portfolio Decline (2026): –19.95% ≈ –20%
This is roughly in line with a typical mild-to-moderate recession market drop.
➤ 2027 Decline
- Tech: –10% × 40% = –4.0%
- Industrials: –5% × 35% = –1.75%
- Energy: 0% × 25% = 0%
📉 Total Portfolio Decline (2027): –5.75% ≈ –6%
⭐ Combined Recession Drawdown (Peak to Trough)
≈ –25% total drawdown
This is less severe than S&P 500 declines in major recessions like 2008 (–56%), and aligns more closely with 2001-style or 2020-style drawdowns.
3️⃣ Post-Recession Recovery Model (2028–2030)
Now apply the assumed recovery pattern:
2028 Rebound
- Tech: +25%
- Industrials: +18%
- Energy: +22%
Portfolio rebound:
= (0.40×25%) + (0.35×18%) + (0.25×22%)
= +21.25%
2029 Growth
- Tech: +15%
- Industrials: +12%
- Energy: +15%
Portfolio growth:
= (0.40×15%) + (0.35×12%) + (0.25×15%)
= +14.1%
🟦 Stress Test Summary Table
Year Tech Industrials Energy Total Portfolio
2026 –30% –12% –15% –20%
2027 –10% –5% 0% –6%
2028 +25% +18% +22% +21%
2029 +15% +12% +15% +14%
4️⃣ When Does the Portfolio Fully Recover?
The portfolio experiences a cumulative –25% drawdown from 2026–2027.
Recovery happens as follows:
- After 2028 rebound: –25% → –8%
- After 2029: portfolio surpasses previous peak
- After 2030: clear gains above pre-recession levels
✔ Full recovery by late 2029
✔ Strong growth resuming 2030–2035
This matches historical patterns where diversified portfolios recover 12–36 months after recession ends.
5️⃣ ETF Behavior in the Stress Test
Technology ETFs (VGT, XLK, QQQ, SMH)
- Likely to fall the most (25–35%) but recover the fastest
- Semiconductors (SMH) may have an even stronger rebound
Industrial ETFs (XLI, VIS, ITA)
- Mild decline
- Aerospace & defense (ITA) may be nearly flat during recession
Energy ETFs (XLE, VDE, AMLP, ICLN)
- Oil supply tightness may cushion downturn
- AMLP provides stability through dividends
- Renewables (ICLN) lag in recession but outperform late-cycle
6️⃣ Key Takeaways From the Stress Test
🟢 Strengths of the Portfolio
- Not overly dependent on any single sector
- Industrials + Energy provide drawdown defense
- Tech drives long-term performance
- Self-correcting balance of cyclical and secular growth
🔴 Risks
- A deep recession (worse than assumed) could push Tech to –40%+
- Energy is volatile and geopolitical shocks could skew results
- Industrials sensitive to capital spending cuts
✔ Final Stress Test Conclusion
Your portfolio is expected to:
- Decline ~25% during a typical two-year recession
- Recover fully by 2029
- Outperform broad market averages over 10 years due to Tech + Industrial productivity + Energy supercycles
My Thoughts
I liked what I produced however please don’t assume any of this is correct and invest your portfolio as recommended. This is largely an AI test and thought experiment. If you’re wondering what I’m doing with my last three posts (this one), here, and here, it is to test AI under various conditions to see what results it produces and I am keenly looking for any major mistakes. I’ve asked AI to create an income portfolio using conventional dividend leaning ETFs, an income portfolio using covered call ETFs and this post asking for a recession ETF portfolio based on historical S&P 500 returns (graph chart above). So far, it’s done a decent job and if it has had any failing, that would be on the author’s part for not giving an accurate prompt for specific things. I am tempted to buy 1 share of each ETF recommended here and track it over the long term.
My next test will be to create a portfolio for massive inflation considering the federal reserve may be lowering rates significantly in the near future with a new fed chair and a deteriorating economy. AI tools are becoming more sophisticated and smarter as time progresses so at some point in the future I will redo these tests and see how the recommendations change over time.
Share The Wealth
Do you think AI did a good job in picking a recession/recovery ETF portfolio of Technology, Industrial and Energy? Let me know in the comments below.