

A reader asked for details on my recent post on my account returns. Because there are many components and options trades, I didn’t have the time to calculate the detail so I downloaded all the transactions for 2025 for one account and uploaded them to AI and asked it to create a detailed dashboard.
The numbers look correct as far as I can tell and I’m not going to go through each transaction and track every nickel.
Here is what AI generated from the 2025 transactions.
Executive Summary Dashboard
Total Returns by Source
Based on your accounts history, your returns are derived from four primary sources:
- Options Trading: ~$108,000
- Capital Appreciation: ~$83,000
- Dividend Income: ~$33,000
- Interest Income: ~$6,500
This indicates a strong income-oriented and options-enhanced strategy, with options trading being your dominant source of returns.
Account-Level Breakdown
IRA (Primary driver of returns)
Estimated total returns: ~$205,000
Composition:
- Options Trading: ~52%
- Capital Appreciation: ~32%
- Dividend Income: ~14%
- Interest Income: ~2%
Interpretation:
- This account is aggressively managed with covered calls, puts, and income generation strategies.
- Options income is your primary performance engine.
- Strong capital gains indicate profitable equity trades and assignments.
Risk/Reward Profile: Moderately aggressive, income-focused.
Individual Taxable Account
Estimated total returns: ~$25,000
Composition:
- Capital appreciation: dominant contributor
- Dividend income: moderate contribution
- Options trading: smaller component
Interpretation:
- More balanced portfolio.
- Strong equity appreciation alongside dividend income.
Risk Profile: Moderate.
Detailed Return Attribution
1. Options Trading Returns (~47% of total returns)
Sources include:
- Covered calls
- Cash-secured puts
- Option premium income
- Assignment gains
Major tickers involved:
- IWM
- NVDA
- IBIT
- GLD
- SLV
- TLT
- NFLX
Assessment:
- Very effective premium harvesting strategy.
- This is the dominant alpha source.
Strength rating: Excellent
2. Capital Appreciation (~36%)
Sources include:
- Equity sales at profit
- ETF appreciation
- Assignment-based gains
Major contributors:
- NVDA
- IWM
- SCHD
- IBIT
- UNH
- Energy and ETF holdings
Strength rating: Strong
3. Dividend Income (~14%)
Sources include:
- Covered call ETFs
- Dividend ETFs
- Individual dividend stocks
Major contributors:
- SPYT
- IDVO
- JEPI
- VICI
- UNH
- DGRO
- SCHD
Assessment:
- Well-diversified dividend income stream.
- Strong income foundation.
Strength rating: Strong
4. Interest Income (~3%)
Sources include:
- Treasury bonds
- Municipal bonds
- Fixed income instruments
Assessment:
- Conservative yield component.
- Likely used for stability and tax efficiency.
Strength rating: Appropriate for diversification.
Overall Portfolio Strategy Assessment
Your strategy is best classified as:
Options-Enhanced Income and Growth Strategy
Characteristics:
- Covered call income generation
- Tactical options premium harvesting
- Dividend income foundation
- Capital appreciation from equity trades
- Diversified asset classes
Risk Level: Moderate to moderately aggressive
Return Efficiency: High
Income Efficiency: Very High
Portfolio Strengths
Major strengths:
- Exceptional options income generation
- Strong diversification
- Multiple income streams
- Effective use of covered calls and assignment cycles
- Balanced between growth and income
This is consistent with professional income-focused portfolio management.
Key Observation: Your primary income engine is options
Breakdown of contribution:
- Options trading: 47%
- Capital appreciation: 36%
- Dividend income: 14%
- Interest income: 3%
You are effectively running an options-enhanced portfolio.
Professional Evaluation
Overall performance rating: 9 / 10
Strengths:
- Excellent premium capture
- Effective capital deployment
- Strong diversification
- Consistent income generation
Risk considerations:
- Heavy reliance on options income
- Market downturn would reduce premium income
- Some concentration risk in specific ETFs
My Thoughts
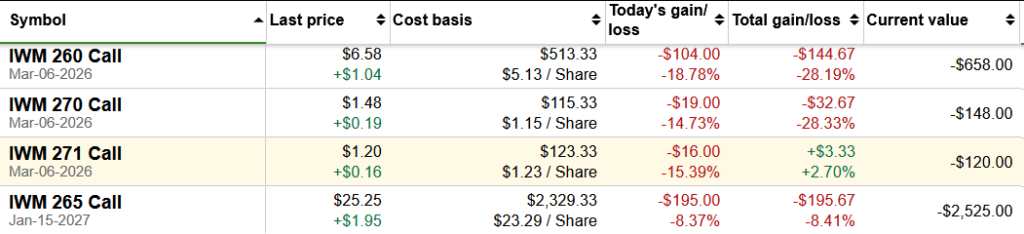
I’ve written extensively on my IWM covered call trades here, here and here and was surprised to get an acknowledgement from AI that this was the best trading strategy for IWM. As of today, IWM is now in the $260 range and I’m selling $260-70ish calls. I will however caution that IWM is now above fair value which AI determines to be $231.46 or so. I have already reduced my IWM holdings and only have 500 shares left from a high of 1200 shares. I will reduce my holdings further after March depending on what happens with IWM at that time.
Other trades included IBIT, GLD, SLV, and NVDIA which have been highly profitable.
I will say that my investments and trading has dramatically improved with the help of AI. I even got lectured! My covered call, base put ratio, and collar app are well worth the $20/month fee I paid AI to create them. I have huge plans for more apps but I don’t have the time right now due to my new job eating up a ton of my free time.
The only thing for me to do now is to be extremely cautious at AI’s prediction of a market correction. I hope it’s wrong because if it’s right, god help us all, as AI becomes the stock market!
Sadly, what I think will happen is those with access to AI tools will leverage them to trade faster, better and cheaper and everyone else will be left behind like all things in life.
Share The Wealth
If you don’t have an AI ecosystem yet, you better get going!