

AI and I are starting to build some really great things. The latest thing I am working on are dashboards for my investment portfolio. I have multiple accounts at multiple brokerage accounts. There are many reasons but part of it is account diversification and keeping within limits of FDIC and SIPC limits.
After a reader asked for more specific breakdown of returns, I decided that I really needed a re-usable tool to do that on a quarter by quarter basis so I’ve been working with AI to build some dashboards. The screenshots below are from a dashboard for one of my accounts.
The process to create it was simple. I downloaded the transactions from January 1st thru March 26 and asked AI to create a detailed dashboard then I asked it to create a simplified version.
The final output is HTML but WordPress has issues with integrating HTML so I have to take screen shots.
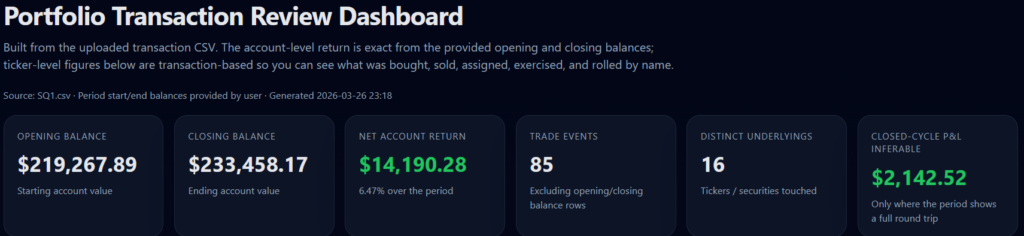
The returns for this account for the first quarter are 6.47% (25.88% annualized, if sustained). You will note that there were 85 trades or about 1 per day for the quarter so this isn’t day trading. Often the daily trade involves selling a call or put or executing a buy-write transaction or something simple.
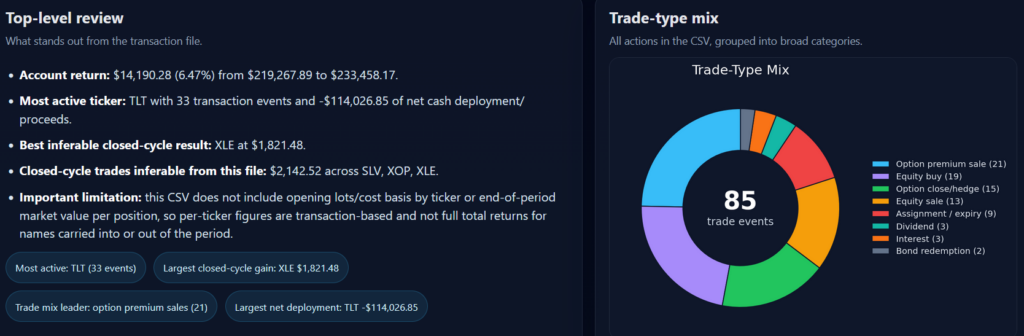
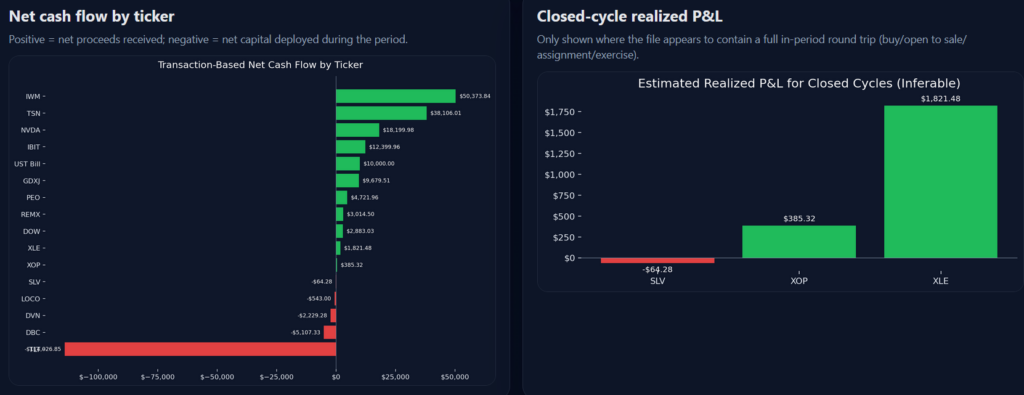
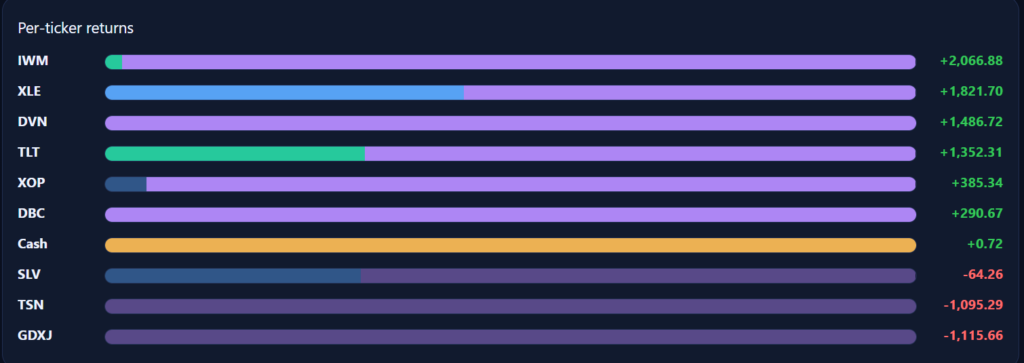
In the image above and below, you can visualize my rotation from IWM to TLT which I wrote about here. I will continue to buy TLT now that the 20 year bond is yielding 5% and I can sell calls on TLT to squeeze out additional income!
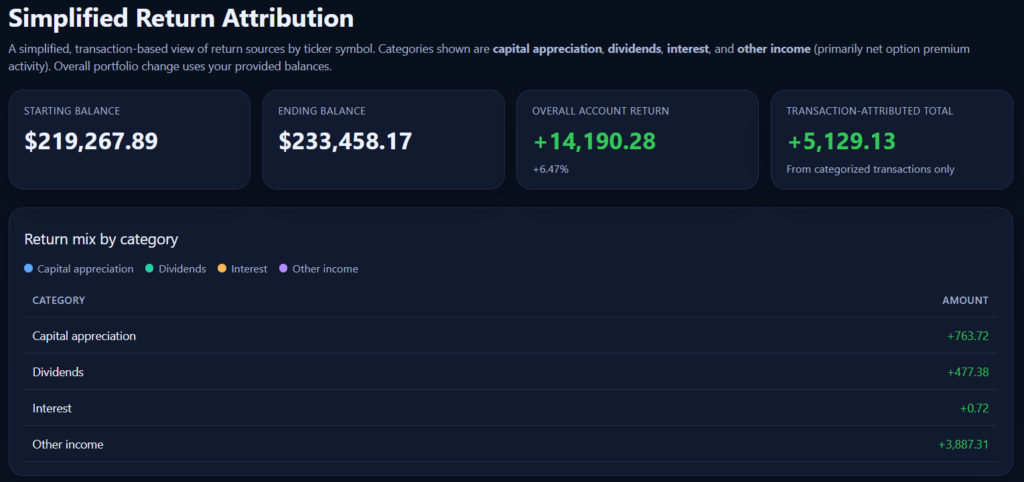
The screenshot below is my favorite. It shows how much money I am making per equity from either dividends, interest, capital appreciation or options trades.
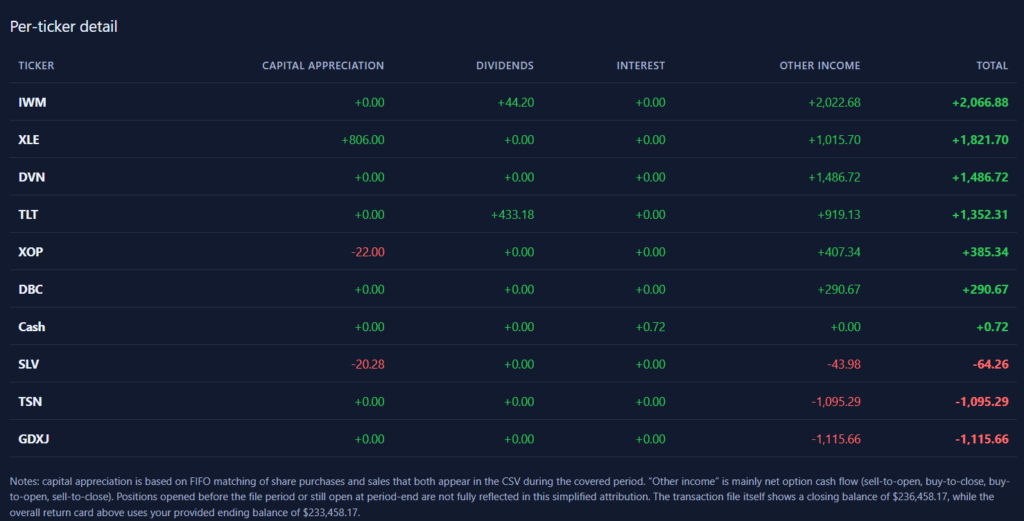
I am still tweaking the dashboard, I may create one that has my biggest “mistakes” (losses) and have AI coach me on improving my trades.
Note that AI created all the dashboard information above from a simple file I downloaded from my broker. I plan on setting up a system for all my brokerage accounts and run it quarterly.
Share The Wealth
If you’re not using AI to optimize your financial life, you’re going to be left behind so what’s holding you back?