
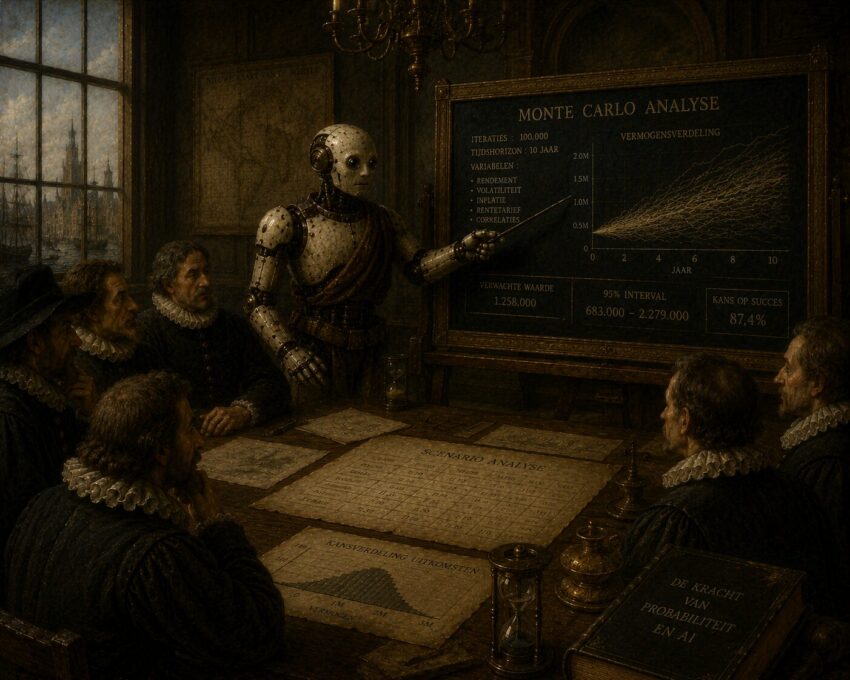
In endless pursuit of the perfect investment portfolio, playing with AI, and my fear of major drawdowns, I decided to play with Claude a bit and ask it to review data Average Joe Investor put together (link below).
I asked Claude to review the data and make an assumption about the AI bubble bursting within the next 5 years and produce an investment portfolio that could weather the storm and provide at least 15 percent returns.
Below is the answer….
The hard truth about the 15% target
Across all 161 funds in your file, only a handful even averaged 15%+ over their lifetimes, and every one of them (SCHG, VGT, SMH, MGK, SOXX) is a concentrated tech/growth vehicle that lost 30–52% in a single year during 2008 or 2022. The broad S&P 500 (VOO/SPLG) compounded at ~14% — and that includes the once-in-a-generation 2009–2021 bull market and the current AI run. So 15% annualized for 20 years sits at the very top edge of what this dataset produced, achieved only by the assets most exposed to exactly the burst you’re worried about.
When I ran a Monte Carlo that forces an AI bubble burst into years 1–5 (calibrated to the dot-com and 2008/2022 crashes actually in your data, ~55% probability of occurring), here’s what happens to five candidate portfolios over 20 years:
| Portfolio | Median CAGR | P(≥15%) | P(≥12%) | 5th-%ile CAGR | Median max drawdown | Worst-case drawdown |
|---|---|---|---|---|---|---|
| 60% S&P / 40% Growth | 11.9% | 27% | 49% | +4.3% | −50% | −62% |
| 100% Growth (SCHG) | 12.7% | 36% | 55% | +3.2% | −59% | −72% |
| Barbell (recommended) | 12.7% | 26% | 58% | +7.0% | −26% | −37% |
| Growth-tilt balanced | 12.0% | 20% | 50% | +6.3% | −29% | −40% |
| Defensive | 11.6% | 15% | 45% | +6.2% | −25% | −36% |
The takeaway: no allocation reliably hits 15%. The most aggressive option maxes out at a 36% chance — and pays for it with a 59% typical drawdown and a 72% worst case (a $1M portfolio falling to ~$280K). That is the trade the 15% target demands, and it’s the opposite of “minimize drawdowns.”
What the data does support
The Barbell portfolio is the standout. It delivers essentially the same median return as going all-in on growth (12.7%) while cutting the typical drawdown by more than half (−26% vs −59%) and raising the worst-case 20-year outcome. It’s the most efficient point in your file’s risk/return space.
The reason it works is in the correlation matrix. Gold (GLD) has a correlation of just 0.06 with dividend stocks and was actually positive (+4.9%) in 2008, and quality-dividend funds (SCHD, DGRW) fell only −3% to −6% in 2022 while growth fell −30%+. These are the only assets in your dataset that genuinely zig when tech zags.
Proposed portfolio
A growth engine for the return, ballast that holds up when AI cracks:
- 25% SCHG (large-cap growth) — the primary return driver
- 15% VGT (tech sector) — secondary engine; SCHG+VGT = your 40% “AI participation”
- 25% SCHD (quality dividend) — ballast, −3% in 2022
- 20% DGRW (dividend growth) — ballast, 12.4% lifetime CAGR with 11.9% vol
- 15% GLD (gold) — the true diversifier and crash hedge
If you want a genuine shot at 15% and can stomach a ~40% drawdown, shift to 35% SCHG / 15% VGT / 15% SPLG / 20% SCHD / 15% GLD (“Growth-tilt”). But recognize you’re trading drawdown protection for that lottery ticket, which conflicts with your stated priority.
Important caveats
A few things worth stating plainly. The “normal” years in this simulation are drawn from 2014–2025, itself an unusually strong bull market, so even these probabilities likely overstate real-world odds of 15%. Past returns don’t predict future ones; a fund averaging 16% historically won’t necessarily repeat it. And rebalancing back to these weights annually is what actually harvests the diversification benefit — without it the portfolio drifts toward whatever’s been hottest (tech), reconcentrating the very risk you’re hedging.
I’m not a licensed financial advisor and this is an analysis of your dataset, not personalized investment advice — your tax situation, age, and other holdings all matter and aren’t in this file. For a 20-year plan of this size, it’s worth running these ideas past a fiduciary advisor.
My Thoughts
There must be some convergence here because I have already been accumulating SCHD (IRA), a bit of SCHG (Roth), and GLD in a few accounts. I checked the overlap and the highest was between SCHD and DGRW at 18 percent. I favored IDVO over DGRW for some reason I can’t recall but I may revisit that analysis.
Average Joe Investor
Share The Wealth
Are you worried about an AI bubble burst?