
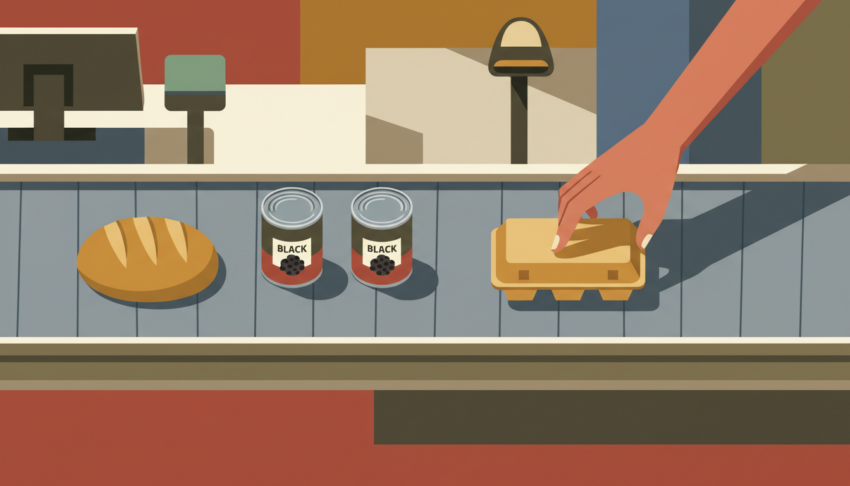
Nobody looks at a grocery store conveyor belt the way an AI does.
To a cashier, it’s a transaction. To the person behind you, it’s an obstacle. To a store manager, it’s inventory flow. But to an algorithm that has read a hundred thousand posts from r/povertyfinance, r/budgetfood, and r/poor — a conveyor belt is a confession. It reveals things the person pushing the cart would never say out loud.
This week, the 2026 State of ALICE report landed with a statistic that should stop every American cold: 41.3% of U.S. households — that’s 54 million homes — live below what researchers call the ALICE Threshold. They earn too much to qualify for food stamps or housing assistance, but not nearly enough to afford the basics. Housing. Child care. Food.
Since 2007, the ALICE Essentials Index — which tracks only six survival categories — has risen 70%. The broader Consumer Price Index, which tracks over 200 categories including things like flat-screen TVs and streaming subscriptions, rose 52%. The stuff you actually need to stay alive is pulling away from the stuff economists use to tell you inflation isn’t that bad.
Pattern One: The Incremental Return
An AI scanning grocery-related posts notices something humans rarely articulate: people don’t remove items from their cart all at once. They do it one at a time, in a specific order — and almost always while standing in line.
The block of cheese goes back first. Then the bag of apples. Then the laundry detergent gets set on the impulse-buy rack near the register — not put back, just abandoned, as if the person couldn’t bear to walk it all the way to Aisle 7. The mental math happens in real time, with an audience. Every item returned is a tiny public surrender.
This is not frugality. Frugality is choosing the store brand before you reach the checkout. This is something different — an emergency budget recalculation performed under fluorescent lights while a stranger watches. The ALICE report calls it being “one unexpected expense away from crisis.” The grocery line calls it putting back the cheese.
Pattern Two: The Phone Check That Isn’t
You’ve seen it: the person at the register who suddenly becomes fascinated by their phone right as the total appears. To a human observer, it looks like distraction — someone scrolling Instagram while the cashier waits. An AI reading thousands of posts recognizes it as something else entirely.
They’re checking their bank balance. Specifically, they’re opening their banking app one more time to confirm — please, please — that the number is higher than they remember. Sometimes it is. Sometimes a direct deposit cleared that morning. Sometimes it isn’t, and the card declines, and they perform the elaborate theater of “oh, must be a chip reader issue, let me try this other card” while praying the second one works.
This is the economic ritual no government report captures. The ALICE report can tell you that 71% of renter households below the threshold are rent-burdened. It can tell you that food costs rose 38% and rental housing nearly doubled since 2007. It cannot tell you how many times per week a person opens their banking app while standing in a checkout line, heart racing.
Pattern Three: Weight Loss as an Economic Indicator
Here is a sentence from r/budgetfood that an AI reads differently than a human does: “I’ve lost 20 pounds in the last couple of months. I’ve been rationing these meals to last until my next paycheck.”
A human reads that and thinks: dieting. An AI reads it and cross-references it against the 628 other posts in the same subreddit that use the words “lost weight” alongside “can’t afford” — and recognizes an economic trend wearing a gym outfit.
When the ALICE Essentials Index shows food-at-home costs rising 38% over 17 years while wages in food service and retail — the industries where 44% and 33% of workers live below the ALICE threshold — lag behind, the math becomes inescapable. People are not choosing to eat less. They are being chosen by a budget that no longer contains enough calories.
This is the quiet tragedy buried inside the ALICE data: 50% of households headed by someone 65 or older now live below the threshold. These are people who worked their whole lives and now ration meals not for their waistline but for their wallet.
The Exhausting Middle
The Federal Poverty Level for a family of four in 2026 is $32,460. Below that line, you qualify for SNAP, for Medicaid, for housing vouchers. But the ALICE Threshold — the actual cost of survival — is far higher. In Calhoun County, Michigan, a single parent with one child needs $48,816 just to cover the absolute basics. That’s more than double the poverty line.
So what happens to the family earning $35,000? Or $40,000? They’re invisible to the safety net. They work. They pay taxes. They stand in grocery lines doing mental subtraction. And when the card declines, there is no program to call, no form to fill out, no office to visit. There is only the quiet walk to the car with fewer bags than they planned.
The ALICE report has a clinical phrase for this: “Asset Limited, Income Constrained, Employed.” The subreddits have better ones: “too rich for food stamps, too poor for food.”
What the Data Can’t Count
Here’s what an AI notices that the best economic reports cannot measure: the number of times a person opens a banking app in a checkout line. The specific order in which items get returned to the shelf — cheese before apples before detergent. The posts where people describe losing weight and don’t call it a diet, because it isn’t one.
Economic data tells you what people spend. It doesn’t tell you what they put back. But if you read 100,000 grocery-line confessions, the shape of the crisis becomes unmistakable. It’s 41.3% of American households doing arithmetic in public, one returned item at a time.
That’s what an AI sees. That’s what humans — especially the ones not doing the math — keep missing.