

Necessity is the mother of invention. My AI built apps are working great making me a ton of money but that doesn’t mean there isn’t room for improvement. A key issue I have right now with options is trade execution. Sometimes the issue is bid/ask mismatch but I think most of the time it is open interest and volume and I wanted a way to help fix this issue.
After looking at options flow data that led me to this interesting observation on TLT, it occurred to me that I could build an app to summarize this type of information in a better way on a dashboard.
I asked AI to build me something and I’ve got something useful now although I am still tweaking it a bit.
Here are some sample files, hopefully they work in your browser!
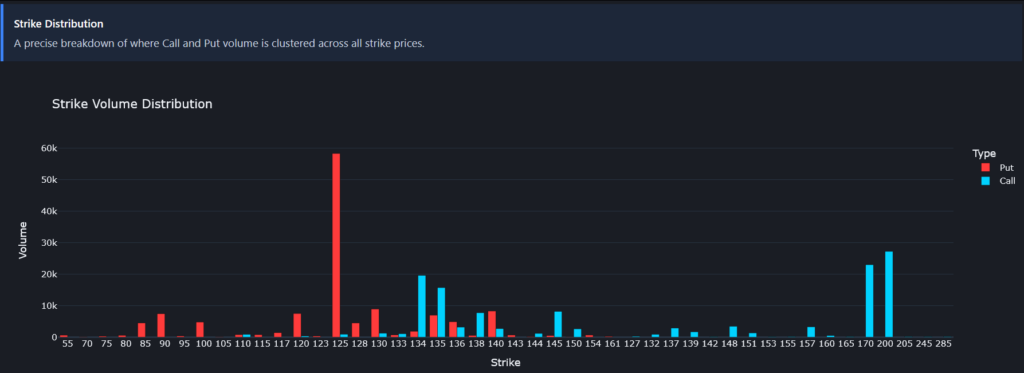
What these dashboards show is summary information from options flow that show how much monetary volume is going into puts or calls, “hot” strike prices, “hot” expiry dates, and other information.
This information now adds an additional layer of information I can overlay with AI’s recommendations from my other apps.
The data in these dashboards is a bit foreboding, there is far more money going into puts than calls for most of these key ETFs which means traders are nervous about the future.
There are investors/speculators on USO (oil) that show oil bets at $200 and beyond so if you are dependent on fuel for a living, be very cautious.
Share The Wealth
Is AI building informative dashboards for you yet?